A
B C and D ARE causes of habitat loss
Hmmmm.....it looks as though answer B and C are exactly the same....typo?
It appears to me that the deposits were LESS than 100/day as the slope of the line gets flatter or lesser (more toward horizontal)...
x4 =16
x2 = +-4
x = +- sqrt (+4) and +- sqrt(-4)
= +-2 and +- 2i
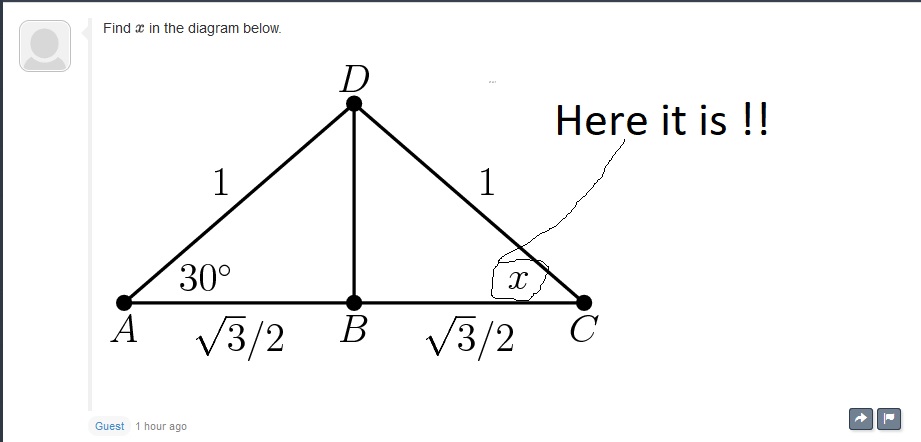
See this:
https://web2.0calc.com/questions/help-pls_68
First one: vf = vo + at (velocity final = velocity original + accel * t) vf =6.6 m/s vo = 0
then use xf = x0 + v * t xf = final position xo = original position (0)
Second one : xf = x0 + vot + 1/2 at^2 to find a
then use vf = vo + a t to find vf
Haha ... JK ~EP
The blue graph is 1/2 the HEIGHT of f (x)
sooooo 1/2 f(x) AND it is shifted UP by 2
1/2 f(x) + 2
A different approach:
2(x-4)^2 -(x-4) + 7 =
2(x^2-8x+16) -x+4+7 =
2x^2 -17x+ 43
a+b+c = 2-17+43
Between day 4 (400) and day 8 (400) the graph is flat.....all of the days between 4 and 8 have the same value of $400