 +118735
  +118735
 It has been a long time since I have done stats but I should be able to head you in the right direction.
First this site (that I found in our reference material sticky notes) is really useful
http://davidmlane.com/hyperstat/z_table.html
\(\sigma=0.5, \qquad \bar x=1.5\;seconds, \qquad n=25 \qquad \alpha=0.1\\~\\ H_o:\;\;\mu=1.8\\ H_A: \;\;\mu<1.8\\ \)
NOTE:
On this graph below I would like to have added a second base lone where the mean is marked at 1.8 and the SD is 0.5.
If I was drawing by hand I would have done this. But i used the webpage that i sited above :)
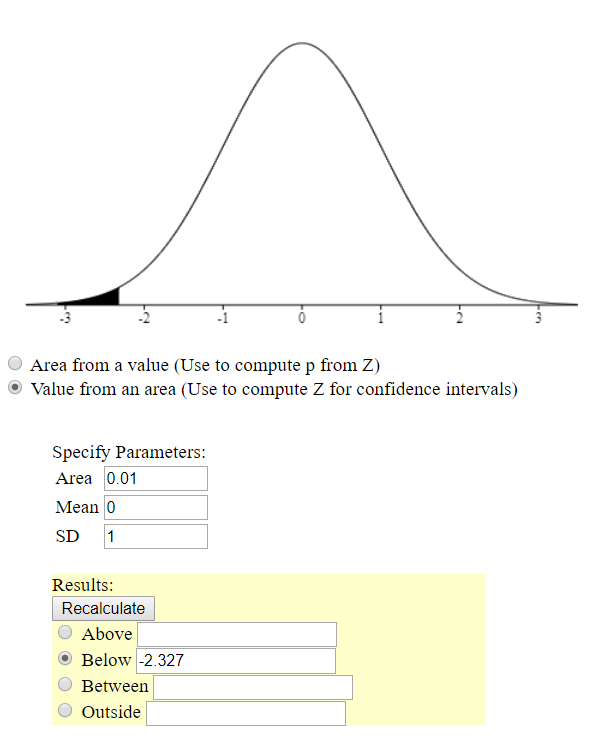
* \(z_{crit}=-2.33\)
* Decision Rule: If \(z_{test}<-2.33\qquad reject \quad H_o\)
\(\text{Calculate standard error}\\\sigma_{\bar x}=\frac{\sigma}{\sqrt n}=\frac{0.5}{\sqrt {25}}=\frac{0.5}{5}=0.1 \\ \qquad \text{Note: It is purely coincidental that this is the same as alpha}\\ Z_{test}=\frac{\bar X-\mu}{\sigma_{\bar x}}=\frac{1.5-1.8}{0.1}=\frac{-0.3}{0.1}=-3\\~\\ -3<-2.33 \;\;\;so\;\;\;H_0\;\; is\;\; rejected,\\ H_A \;\;is\;\;accepted \)
Conclusion: The hypothesis that the mean population is less than 1.8 is accepted (1% significance level)
This means that there is a less than 1% chance that the exercise program is NOT effective.
Conclusion: At a 1% significance level it can be concluded that the exercise program IS effective.
That should get you started I think.